Dynamic and interactive visualization of weather data with
SVG
Geo-information, Application building
Ralf Kunze
Research and teaching assistant
Institute of
Computer Science, Osnabrueck
Albrechtstraße 28
49069 Osnabrueck
Germany
rkunze@uos.de
Dipl.-Systemwiss. Ralf Kunze, born 1973 in
Oldenburg, has graduated in applied system science from
the University of Osnabrueck in 2001. The topic of his
diploma thesis has been the development of a Macromedia
Flash generator for interactive visualization of XML
based data.
He works as a research and teaching assistant in the
multimedia group of the institute for computer science
at the University of Osnabrueck. He supervises several
diploma and bachelor theses mostly in the domain of
geographical information systems and other data
visualization with SVG.
He has a focus on web publishing, data visualization
and mobile computing. In cooperation with the
Max-Planck-Institute in Hamburg he pursues his PhD
with the development of a real time climate data
visualization tool in SVG.
Robert Mertens
Research and teaching assistant
Virtual Teaching Support
Center at the University of Osnabrueck
Schloßstraße 9
49069 Osnabrueck
Germany
rmertens@uos.de
Robert has studied cognitive science at
the University of Osnabrueck. Currently,
he is a PhD Student (computer science) and
working at the Virtual Teaching Support Center
at the University of Osnabrueck. He has been
working with SVG since spring 2003 to build an
SVG-based web-presentation interface for
recorded lectures as part of his PhD work.
The main focus of this work is interactivity and
the implementation of a hypermedia navigation
concept for timebased media. The technical part
of it involves bringing together SVG, Realmedia
and some ECMA/Javascript. Apart from working on
the interface, he is also working on the recording
process and on methods to use lecturer interaction
for navigation purposes.
Prof. Dr. Oliver Vornberger
Professor
Institute of
Computer Science, Osnabrueck
Albrechtstraße 28
49069 Osnabrueck
Germany
oliver@uos.de
Oliver Vornberger, born 1951, graduated in computer science
from the university of Dortmund in 1976 and worked as research and
teaching assistant at the University of Paderborn. After his
PH.D. in 1980 he spend a year as a postdoc at the University of
California at Berkeley. Since 1989 he has a full professorship at
the University of Osnabrueck and is head of the multimedia working
group with a focus on web publishing and computer
graphics.
In many regions around the world, changes in weather
conditions are not a slow process. With the weather being
likely to break up in a matter of hours if not minutes every
other day, people who have to adapt to the weather highly
appreciate sound and accurate weather forecasts. As weather
depends on a multitude of global and local factors, however,
weather forecasts require complex and time-consuming
calculations. On top of this, the resulting forecast data is
hard to read for the non-expert. Typically the data is
visualized in maps containing static pictograms. Compared to
this, an animated weather viewing tool can facilitate the
users' understanding of the development of a weather situation.
To implement such a tool, SVG seems to be the means of
choice, as it has begun to play an increasingly important role
in the application domain of GIS (Geographical Information
Systems). This is mainly due to SVG being an open W3C standard
and it being XML-based. SVG is thus coming with a document
structure that is as easy to generate as it is to manipulate in
dynamic applications. Additional advantages of SVG are dynamic
reloading of information, interactivity, server side
generation, scripting and the fact that it is vector based.
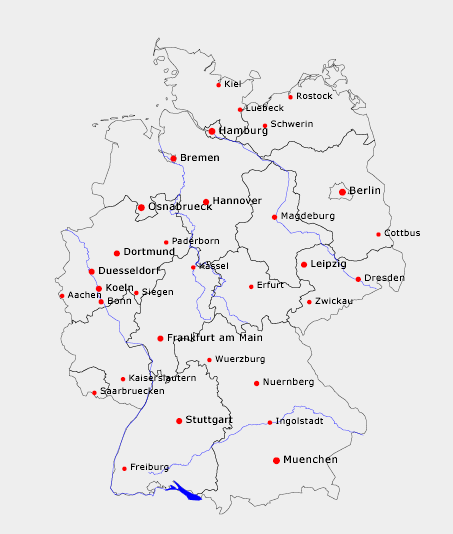
The application presented in this paper depends on many of
these features as it brings together both static geographical
data such as borders, rivers and cities and weather data that
is visualized dynamically. Interactivity and scripting are
crucial to the interface since users need special views on the
information depending on where they are and what they plan to
do. A family planning for a weekend trip to the North Sea will
most likely want a totally different view than an event manager
planning a concert.
In short, different needs require the interface to show
different parts of the weather chart in different spatial and
temporal resolutions. In response to this, the interface
presented in this paper allows selecting arbitrary rectangular
regions within the overall map, zooming in and out of these
regions, showing weather development at specific hours or as a
time-compressed 24-hour animation.
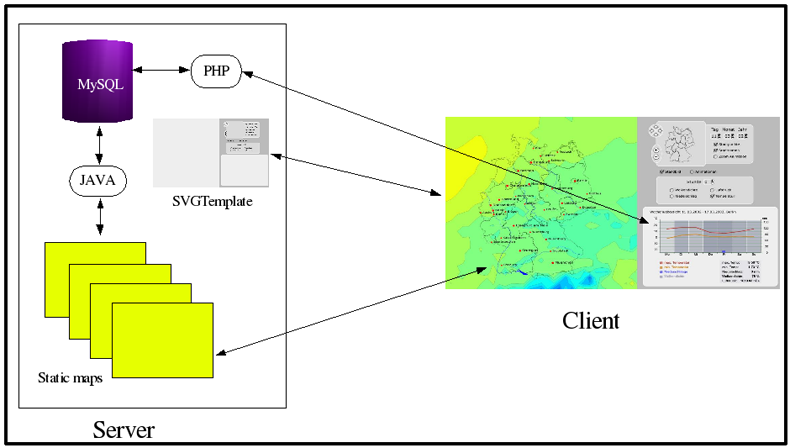
The application behind the interface basically consists of
three different server side components: preprocessing of the
weather data, organizing data storage and handling the
interface's query action by a number of scripts. The data
itself comes from the German Weather Service (Deutscher
Wetterdienst) and covers weather development for Germany and
parts of the bordering nations. As the application is still
under development the data used in the example is historical
data that was available for free. The preprocessing is done by
a number of C and Java programs. These programs restructure the
data and convert it into a format that is more appropriate to
visualization. The data is then stored in a MySQL database
where it is accessible by geographical position and time
indices. This database can be accessed via a number of
PHP-scripts which are in turn used by the SVG-Template on the
client computer.
Since the data is delivered to the SVG template as an SVG
group, it can easily be loaded by the SVG template using SVG's
getUrl and parseXML functions. When the data is no longer
displayed, it is removed from the DOM tree. The same holds for
text and graph based information that can be displayed for a
set of cities in the area covered by the data.
However, not all actions performed by the interface require
this dynamic reloading of datasets. To a certain extend,
zooming can always be done using the graphical data already
displayed and thus using SVG's own zooming mechanism. Reloading
is also not used for fading in and out certain sets of data
like temperature, air pressure or precipitation. This allows
keeping the interface's response time at a reasonable speed. In
some cases even a mix of reloading and standard zooming is
used. One example is adding certain details at a specified zoom
level to facilitate the visualization of local phenomena.
Loading higher resolution data when zooming in is another point
where this method is used.
Apart from describing the technical details of the
interface, preprocessing, data storage and communication
between the different components of the application, the paper
will also give an overview of current weather visualization
tools. An example of the Interface can be found at
http://snowball.informatik.uni-osnabrueck.de/cgp/index.svg .
1. Introduction
2. SVG and Flash
2.1 Spread of SVG and Flash
2.2 Synchronizing frames vs. synchronizing time
2.3 File size and automatic generation of documents
2.4 Streaming
2.5 Scripting
2.6 Conclusion
3. SVG Weather
3.1 Server side data processing
3.2 The Database
3.3 Geography
3.4 The Front-end
3.4.1 SVG Template
3.4.2 Dynamic reload
3.4.3 SVG Scripting
3.4.3.1 Manipulation of elements and attributes
3.4.3.2 Loading data
3.4.3.3 Manipulating the ViewBox
3.4.3.4 Using tiles
4. Conclusion
Bibliography
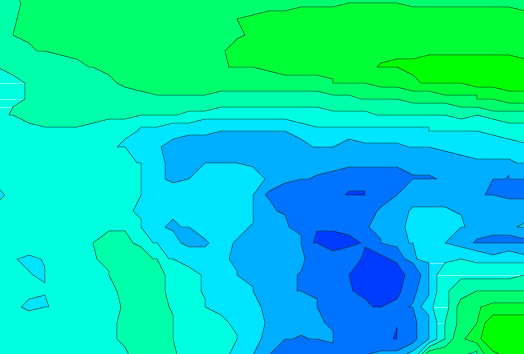
As with most complex data, weather data requires a
considerable amount of structuring and visualization to become
understandable for human use. Commonly, weather forecasts
consist of a set of maps showing isolines and isoareas
representing temperature, air-pressure, precipitation and so on
[WalchFrater].
In print-media, these maps have to be static according to
the static nature of the medium itself. When delivered in
continuous media like films or computer animated graphics,
however, the effect of visualization can be further improved by
representing weather changes as dynamic developments.
TV stations around the world have employed this technique for
years, while most internet-based weather information services
still rely on static maps. At first glance, this is hardly
understandable, especially given the fact that the internet is
becoming a major source for all kinds of multimedia
documents.
A more detailed inspection of the demands on an
internet-based weather forecast, however, reveals the
differences between weather forecast and other multimedia
content. Most multimedia web contents like video clips, games
or audio documents remain up to date considerably longer than
weather forecasts. Also, weather forecast has to be localised
in order to be useful. An additional difference is that a high
degree of interactivity is desired to select spatial and
temporal clippings that fit the user’s information goals. The
last but not least important difference to this fictional
content is that weather forecasts have to be generated from
real world data.
These facts impose a number of constraints to the production
of high-quality, internet-based visualizations of weather
forecasts that do not apply to other multimedia content.
Especially the short-livedness of the content and the
requirement to compute an appropriate visualization out of vast
amounts of real world data call for fully automated data
processing. Added the need for interactivity, the challenge
lies not only in data processing but also in finding an
appropriate presentation format.
This paper presents both, an approach for processing weather
data that comes in the GRIB (Gridded binary) format [NOAA] and a web-enabled viewer implemented in SVG.
As data presentation is crucial for the application purpose,
the graphics format to be used for presentation had to be
chosen carefully. Since the visualization could best be
realized by vector graphics the two formats in question were
Flash and SVG. A closer inspection of both formats and a
prototype implementation of the viewer interface in Flash [Kunze][Stark] finally lead to the
selection of SVG.
The first part of this paper gives a detailed overview of
both graphics formats with a special focus on scripting, which
mattered most for the application. The second part describes
the application front-end, back-end and underlying
implementation details.
Due to excellent marketing strategies, Macromedia Flash
has become widely spread in the last few years. Being
integrated into many web-browsers, the Flash viewer plug-in
was easy to use for most internet users. This rapidly led
to an increased popularity of the format.
In March 2005, round about 90% of all browsers supported
Flash [Macromedia I]. An easy installation
process and the plug-in download size of mere kilobytes
closed the gap for those who did not already have the
viewer installed on their computers. The small size of the
plug-in was especially important at an early stage of the
viewer’s distribution. After all, back in the 1990’ies when
broadband connections were not as common as they are now,
download size really did matter.
Another factor that heavily contributed the format’s
popularity is constituted by Macromedia’s constant efforts
to make the viewer availably for all common browsers and
operating systems.
In comparison to Flash, SVG can only be viewed by a
smaller group of internet users. SVG viewers are deployed
to over 100 million desktops (29.10.2004) [W3C I]. If we suppose there are round about 500
million internet users, only 20% are able to view SVG
contents. One reason for this might be that SVG is
relatively new. While Flash was introduced in 1996
[Macromedia II], the SVG standard 1.0 has not even been
finished before September 2001 [W3C II].
Another reason might be the complexity of SVG which
demands any viewer plug-in to implement a considerably
larger number of features and effects than the Flash viewer
plug-in. This did not only lead to an increased download
size of the plug-in software but also to a significantly
higher workload for those who wanted to write an SVG
plug-in for different browsers and operating systems. Many
viewers do not fully implement the SVG standard but only
demonstrate that it is possible to render SVG in a certain
browser. In fact, the most features so far have been
implemented by the Adobe SVG plug-in, which, however, does
not implement the complete SVG standard [Adobe I]. On top of this, the latest version of
this plug-in is only available for the windows operating
system.
Yet another fact that might account for the rather low
spread of SVG might be that it had not been integrated into
any popular web-browsers. Current developments like the
Mozilla SVG Project [Mozilla] and the
latest version of the Opera web-browser [Opera] though, are to change this situation
soon, so it is most likely that SVG will have a much larger
audience in the near future.
In Macromedia Flash, synchronization is handled by using
key frames [Flashkit]. Much like in a
cartoon movie, an animation is split up into a sequence of
pictures. Object positions between these key frames are
interpolated to allow for fluid movements. In graphics
terminology this is called tweening. This technique is
especially useful for playing complex animations on slow
computers. In case the rendering uses too many resources,
frames can be left out to save computing power. Frame based
navigation within Flash animations is another point where
the use of key frames shows its strengths. The state and
position of objects at the desired time can easily be
computed using the data of the nearest key frame. However,
frames do not allow for precise timing of animations.
Whereas the frame in which an animation is supposed to
happen can be specified, there is no means to start an
animation between two key frames.
SVG features time based placement of animations. This
way, animations can be planned far easier than in Flash.
Any schedule describing what happens when can directly be
encoded in SVG. When more complex applications are
considered, though, this approach causes some problems. In
time based navigation, the state and position of each
object has to be calculated anew whenever time is
manipulated. Especially in documents using many concurrent
animations, this can cause considerable delays [Fox].
Macromedia Flash is a binary format. It can thus not be
easily edited. For a long time, Macromedia did not publish
any specification of the format. Finally, however, the
specification has been made available, mainly for marketing
reasons [Macromedia III]. This lead to the
development of a number of applications that could be used
to edit Flash, which in turn lead to a further spread of
the Flash format. The fact that Flash was not built to be
generated automatically resulted in documents not being
configurable by the server. In order to solve this problem,
Macromedia introduced the so called Flash Generator. The
software featured the ability to swap predefined symbols on
the server. This way, customised films could be created on
the server and sent to the user. Due to its rather high
price, however, the software did not rally break through.
Another interesting fact is that publishing the format’s
specification did not lead to the development of many
applications that could generate Flash dynamically.
Flashweather [Kunze][Stark], the ancestor of the application
presented in this paper is one of the few exceptions.
Concepts like Macromedia Flex [Macromedia IV] or Openlaszlo [OpenLaszlo] have improved this situation, but
they are still too limited to seriously tackle the problem
of dynamic data visualization. The binary structure of
Flash files has proven to be a very good decision when it
comes to file size. Efficient packaging strategies are
employed so that file size can be kept at a more than
reasonably low level.
Generation of SVG documents is kept as easy as it can be.
Designers who are familiar with the document format can
create impressive designs even with a simple text editor.
Since SVG is XML-based, it is well structured and easy to
edit. It is designed to automatically modify or generate an
SVG document with the help of scripts or server sided
applications. This advantage however is directly linked to
SVG’s biggest problem, its immense file size. One very
simple and also very effective approach to counter this
problem is using the ZIP algorithm to compress the data
[ShigeruMasaru]. Reuse of CSS styles is another
strategy to keep SVG files small. Shapes’ properties can be
stored inside definition tags (<def>) and can then be used repeatedly throughout the
document. This is especially effective when styles are used
many times. In some cases it also pays off to re-use
predefined shapes. These shape do not have to be used the
way they come as arbitrary properties of predefined shapes
can be altered whenever necessary. The definition of text
fonts for often used fonts can also have a considerable
impact on file size. Storage of different polygons and
lines that do not overlap but that do have the same colour
etc. are another way to reduce file size of SVG
documents.
Macromedia Flash is designed to be streamed. This can
best be explained by taking a look at the format’s internal
file structure [Macromedia III]. Macromedia
Flash (also called SWF) consists of so called tags which are
stores in records. SWF has tags for shapes, animation
commands and script command. Tags can refer to other tags
but only if the tags referred to are placed closer to the
start of the file than the referring tag. This way,
animations can already be played, even though they are not
completely loaded. SVG is not limited by this constraint.
The down side of this is that no animation can be shown
before the document is loaded completely and before the DOM
is constructed. While this
constitutes a major disadvantage, it can be easily
circumvented by extending the DOM dynamically. The
functions getURL() and parseXML()
that come with the Adobe SVG plug-in allow for reloading
parts of an SVG document at any time. This mighty feature
allows to first load the start of an animation and to
extend it later by loading further elements. In contrast to
Flash, these elements can even be selected by the user at
run time. In the end, this makes SVG much more flexible and
dynamic than Flash. It has to be noted, however, that these
two functions are an extension that works only in the Adobe
SVG viewer [WinterNeumann].
SWF incorporates ActionScript [Moock],
which is an easy to learn script language that has all
elements necessary to manipulate a Flash animation.
Controlling the timeline of an animation is rather easy.
Jumping back and forth in the timeline can be rendered
almost instantly because of the key frames used (see
above). Since the language is bound to the elements used in
a film, existing elements can be changed, but it is
impossible to add new elements or to remove existing
ones.
SVG can be manipulated by different scripting languages.
Since it is represented as a DOM, it can be accessed by any
scripting language that can manipulate a DOM in a
web-browser [WilliamsNeumann]. Among the
most common of these languages are JavaScript, Jscript,
ECMA Script and Visual Basic. A disadvantage of this
technology is that different scripting languages do not
work in all web browsers. Adobe’s SVG plug-in for instance
has its own ECMA Script implementation to overcome this
problem. Using no platform-specific script language and
sticking to the plug-in's ECMA Script is a good way to avoid
the danger different web browsers.
As SVG scripting manipulates the DOM, it provides a
comprehensive set of methods to alter the documents
structure. As mentioned above, the functions
getURL() and parseXML() even
allow to dynamically load data from a server and adding this
data to the DOM in run time. It is also possible to create
totally new nodes in the DOM.standardized ECMA
Existing tags can be extracted using their ID value and
then changed by manipulation of their attributes. This
technique even allows changing an animation while it is
already running. This makes scripting in SVG a mightier
tool than in SWF.
Macromedia Flash is well suited for creating
sophisticated websites. Flash generators like Macromedia
Flex or Openlazlo enable even users with little experience
to create Flash films. Flash is widely spread and the
majority of web users can watch Flash on their
browsers.
When it comes to visualization of complex or dynamically
changing data, however, Flash is not really the means of
choice. The experience with weather visualization described
in this paper has shown that SVG is much better for this
task. SVG though still has a number of problems which will
in part be solved by time while others demand some work.
The comparably low spread of SVG definitely falls into
the first category. SVG can easily be generated
automatically and is thus a good means for visualizing data
sets. Because of this, SVG is already used in a large
number of scientific contexts. Time based navigation in SVG,
however, is still an issue demanding attention.
The application presented here uses an SVG front-end to
deliver an interactive visualization of weather forecasts in
different zoom levels. To realize this, a range of techniques
is required on both server and client side. The client side
front-end is written in JavaScript to allow for interactive
zooming and dynamic reloading of data from the server. Server
side computation is done by a number of scripts in PHP that are
called from the client side part of the application. There are
an additional number of scripts and java applications running
on the server for off-line data processing as well as a
database in which the data itself is stored.
The overall structure of the application can be described as
follows:
- an interactive SVG front-end for visualization and
dynamic reload of the forecast data
- a number of PHP pages on the server for communication
from front-end to server
- a database in which the weather forecast data is
stored
- scripts and applications for updating and
pre-processing weather forecast data in the
database
The following sections will describe these parts in
detail.
The first step is pre-processing of the forecast data. As
weather forecasts come as a set of raster data, it is necessary
to transform the data into isolines and isoareas. This is done
by the modified line following algorithm developed by [WilliamJSnyder]. The algorithm traverses the raster once for
each isovalue. It successively constructs isolines that are
later transformed into polygons.
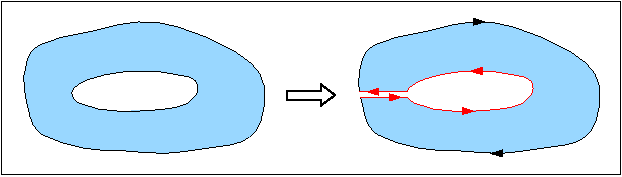
Further processing becomes necessary as the visualization
should allow for multiple datasets to be visualized
simultaneously. This requires each dataset to be at least
semi-transparent so that the view of data visualized on a lower
layer is not obstructed. This means that isoareas describing
the same feature like temperature can not simply be arranged
one on top of the other. Instead, the shape of the smaller
polygon has to be cut out of the larger one. This leaves the
larger polygon as some kind of doughnut with a hole in its
middle while the smaller polygon remains unchanged. To
determine which polygon is the larger one, a basic property of
isoareas is used. As isoareas do never overlap, one area lies
always completely in or out of the other (See fig. Figure 2).
It is thus sufficient to check whether one point of a polygon
lies inside another polygon. Another fact that facilitates testing
is that an isoarea with isovalue k can only be contained in
isoareas with isovalues k -1 or k + 1.
Building one of the doughnuts is very easy because of the way
in which polygons are described in SVG. The path description of
the inner polygon can simply be added to the path description
of the outer polygon without any further modification. The
moveto command at the beginning of the smaller polygon’s path
description has to be copied into the new path description, too.
Fig Figure 3 shows the description of a
resulting “doughnut” polygon. The coordinates from the
surrounding polygon are named x1, y1 to xn, yn, the coordinates
from the inside polygon are named a1, b1 to an, bn.
<path d=“M x1,y1 L x2,y2 x3,y3, x4,y4 ... M a1,b1 L a2,b2 a3,b3, ... „
style=“fill-rule: evenodd; fill:RGB(0,15,200); stroke:black“/> |
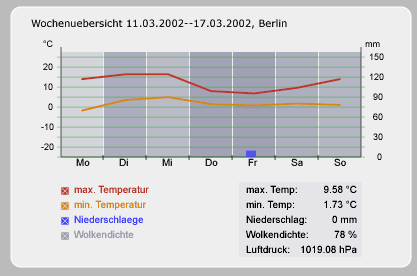
Another feature that requires additional server side
pre-processing is the city weather forecast overview shown in
fig Figure 4.
The overview describes data like temperature or
precipitation in diagrams at different granularities (hour,
day and week). To make this data available by city, the data
corresponding to the geographical coordinates has to be
collected by a script.
The database used is a MySQL database containing a total of
about 137 MB in 2860 tables. This size corresponds to a seven
day forecast for the area of Germany. The tables can be
separated into five groups:
- Weather for Germany: geographical coordinates and
corresponding weather data.
- Tile weather: coordinates and weather data of a
clipping
- Tiles: data for each tile
- City specific data: name and coordinates
- Temperature table: colour values used to visualize
temperature values.
Connections to the data base are implemented using both, Java
and PHP. The transformation of the information stored in the
database into SVG is realized using two different strategies.
One part of the data is already stored as SVG while the other
part is generated on demand.
The most common and the most computationally intensive
elements are created in a pre-processing step and stored on the
server already as SVG. This includes the map of Germany as well
as isolines and isoareas for temperature, precipitation and
cloudiness. Other information like city based temperature or
precipitation overviews are transformed on demand.
Due to the necessity of complex algorithms to compute
isolines and isoareas, the processing of data to be stored as
SVG on the server is done in Java. Whenever new data is put on
the server a number of Java programs start the
transformation.
The dynamic processing for on demand generation of SVG is
done using PHP. The reasons for this are that PHP can easily
interact with MySQL and that it is open source software.
The client software can start a PHP script on the server by
calling the getURL() function in the Adobe SVG
plug-in. In turn, the script starts a MySQL statement,
transforms the result into SVG and sends the SVG back to the
client. On the client side, this SVG is integrated into the DOM
by using parseXML().
The combination of these techniques has lead to very high
degrees of both, performance and efficiency.
The map of Germany is generated using shape files. In shape
files, geographical information is stored as vector based data,
which facilitates the conversion to SVG. The shape files are first
converted into MapML, an XML based description format. The
resulting files are then transformed into SVG. A drawback was
constituted by the fact that the maps at hand contained a wealth of
information. Unfortunately this would have resulted in a map
representation too large for our purposes. As the map will only be
static, however, some manipulation could have done manually. This
includes adding the most important rivers as well as bordering
countries. Information about the cities shown on the map is stored
on different layer [Dickmann].
Storing different kinds of information in different layers has by
the way proven to be a very good idea, as this approach helps to
fade in and out different layers at will. Using the group tag
(<g>) together with a definite id has
worked very well to speed up this process.
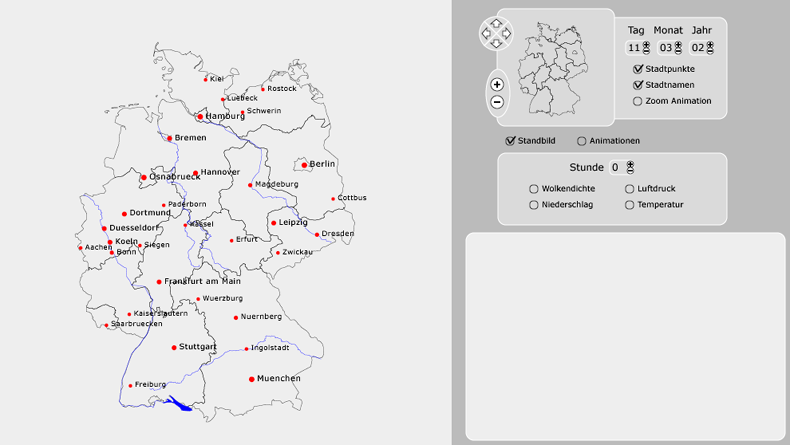
Apart from visualizing the data, the user interface offers a
menu which enables the user to zoom in and out and to control
which kind of information is shown. The viewer’s own zooming
function is disabled to prevent zooming in and out of the
control interface which is implemented as an SVG element.
Another advantage of controlling the zoom function via a menu
is that a number of intermediary scripts can control which data
is shown at a certain zoom level.
This can speed up both rendering and loading considerably
since the initial graphics can be kept simple. Further objects
can be loaded and added into the DOM when needed. Objects that
are no longer needed can be removed. This is especially helpful
since the Adobe SVG plug-in has shown to slow down immensely
when many objects are stored in the DOM. The dynamic
manipulation described above can keep the DOM reasonably small
at all times.
The front-end itself can be divided into three major parts.
The first contains the menu and placeholders for a number of
elements. This part will be called template. The second part is
the reloadable component containing city diagrams, isolines and
isoareas. The last part comprises a number of scripts that
control the application. Apart from increasing the
application’s dynamics and flexibility, his design has also
further a modular development approach.
The following paragraphs explain each of these three parts in
detail.
The SVG that contains the control elements is the so
called template. Both, layout and menu elements are
specified. The template does not, however, contain the data
to be shown, or the scripts to be used. This way, a
designer can build the look and feel of the interface
without having to deal with the underlying code.
The interface allows manipulating time, the kind of
information shown (temperature, precipitation, etc.),
presentation mode and zoom level. Three additional fields
are used as placeholders. According to loading state and
user action, these placeholders are replaced by the main
part showing the map, by a city diagram and by a smaller
version of the map showing which part is depicted in zoom
focus.
Integration of dynamically loaded data can be realized by
using the SVG image tag. This tag allows dynamic integration of
images as well as complete SVG documents. In the document,
this tag looks like this:
<image id=“karte“ x=“0“ width=“575“ xlink:href=“germanmap.svg“ />
|
The disadvantage of this approach is that data added this
way becomes assigned to a separate DOM. The reloaded data
can thus neither access the primary document DOM nor that
of other reloaded data [Watt et al.].
As mentioned above, SVG documents are represented in the
viewer as DOM trees. This means that nodes can be added,
altered and removed. In particular, this means that
elements and attributes can be changed and that new shapes
can be added to the document.
The root node of an SVG document can be obtained by
calling the method getOwnerDocument() on
any node in the document. This means that the script
needs to have a reference to one of the document’s
nodes in order to work. Such a reference can be
delivered by the init method which is called when the
document is loaded. This method is automatically called
with an event which belongs to the document.
var svgdoc; // define globally! function

init(evt) {
  svgdoc = evt.getTarget().getOwnerDocument();
} |
For further discussion of this example see [HauserWenz]. Once the document is known,
arbitrary nodes can be retrieved by calling
getElementByID():
elem=svgdoc.getElementById("rectangle1"); |
The element can then easily be modified:
elem.setAttribute(„x“, „10“); |
<rect id=“rectangle“ width=“100“ height=“100“ x=“0“ y=“0“
      fill=“blue“ onclick=“fillGreen()“/>
|
The ECMA-Script performing the task:
function fillGreen() {
  document.getElementByID(„rectangle“).setAttribute(„fill“,“green“);
} |
Reloading data is not supported by ECMAScript.
Adobe’s SVG plug-in does, however implement additional
scripting functions that can integrate reloaded SVG
elements as part of an existing DOM. A file can be
loaded from the server by the getURL()
function, be parsed by the parseXML()
function and finally be integrated into the DOM as
follows.
function loadFile(fileName) {
  getURL(filename, fileLoaded);
} |
function fileLoaded(data) {
  if(data.success) {
    var node = parseXML(data.content,document);
    document.getRootElement().appendChild(node);
  }
  else {
    alert('Loading failed!');
  }
} |
The second argument to getURL() (in this
case fileLoaded) is a callback function that is called
automatically with the data loaded from the URL. The
data is stored in a data object that contains a number
of fields. Among these are success and content. The
content can be transformed into an SVG node by calling
the function parseXML(). The resulting
node can then be added into the existing DOM. To place
the node at a desired location, the function
getElementByID() can be used.
As mentioned above, the viewer’s own zooming function
is disabled for various reasons. The interface's zooming
function is realized using the SVG document’s “viewBox”
attribute. For zooming, the dimensions of the viewBox
remain constant but the size of the area that is shown
in the viewBox is shrunk. The specified area is then
automatically enlarged by the Viewer to fit the
viewBox. The following example will explain the code
for this procedure in detail.
The viewBox is defined as follows [Eisenberg]:
<svg  x=“0“ y=“0“ width=“400“ height=“400“ viewBox=“0  0  400  400“>
 ...
</svg>
|
This way, an SVG that is 400 pixels wide and 400
pixels high is displayed fully in the viewer. To zoom
into the picture and to show the inner part of it in
double size, the viewBox is redefined as follows:
<svg  x=“0“ y=“0“ width=“400“ height=“400“ viewBox=“100  100  200 200“>
 ...
</svg>
|
The ECMAScript code for this action can look like
this:
 var elem = document.documentElement.getElementById('karte');
elem.setAttribute('viewBox', xnew+' '+ynew+' '+newWidth+' '+newHeigth); |
This way, an area that was originally 200 by 200
pixels large, starting at the coordinates 100, 100 is
shown in the viewBox. Since the size of the viewBox
itself has not been changed, the area is shown in
double size.
An alternative technique is animating the viewBox.
This allows for a smooth visualization instead of the
abrupt change that is caused by the technique described
above. An example for an animation that slowly zooms
into the image can look as follows:
<animate id=“anim“ attributeName=“viewBox“ begin=“undefined“ dur=“2s“
         values=“0 0 400 400; 100 100 200 200“ fill=“freeze“/>
|
After the zoom has finished, the user can move the
enlarged area within the overall map. The scripting
part of this is done by adjusting the coordinates of
the visible area within the viewBox. If the viewBox is
defined by:
<svg  x=“0“ y=“0“ width=“400“ height=“400“  viewBox=“100  100  200 200“>
 ...
</svg>
|
It can be moved 50 pixels to the right, so the
underlying map will scroll to the left:
<svg  x=“0“ y=“0“ width=“400“ height=“400“  viewBox=“150  100  200 200“>
 ...
</svg>
|
The script code moving the viewbox in fluid motion
looks like this:
<animate id=“anim“ attributeName=“viewBox“ begin=“undefined“ dur=“2s“
         values=“100  100 200 200; 150 100 200 200“ fill=“freeze“/>
|
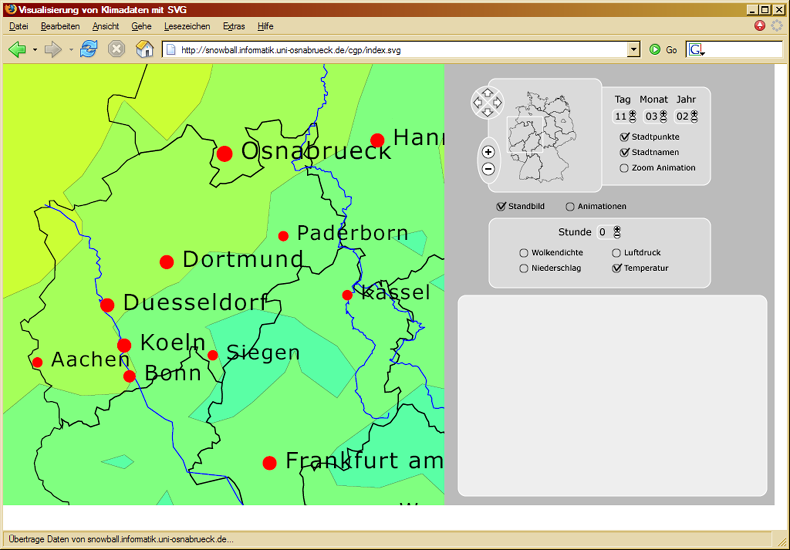
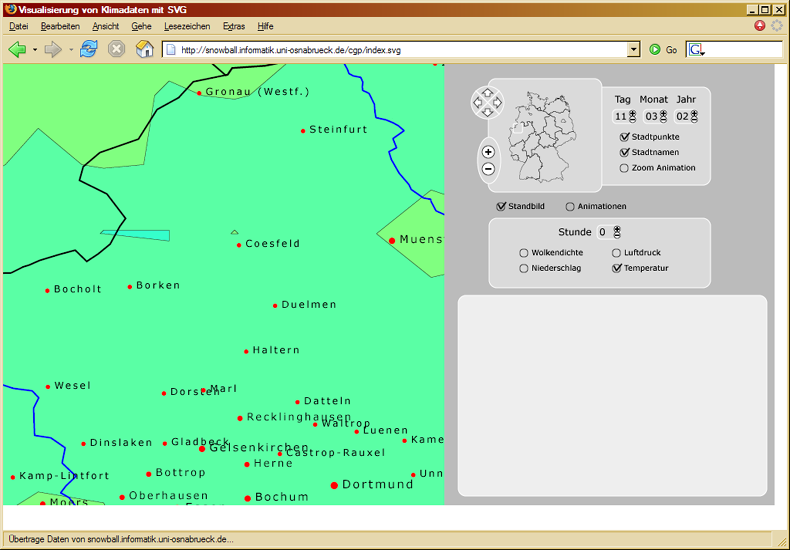
Zooming into the map results in a smaller part of the
map being shown in higher resolution. Without any
further program-side manipulation, however, this does
not add more information. In the weather viewer,
additional data is reloaded depending on the zoom level
shown. At higher zoom levels, smaller towns and rivers
are shown to facilitate orientation. This additional
information is only reloaded for the area in question.
This is done by organising the data into so-called
tiles. Loading only a tile instead of the whole map
means faster downloads and saving a considerable amount
of client-side computing time as the client has to
manage significantly less elements.
This technique is realized by splitting the map into
a number of overlapping tiles. The tiles overlap to
guarantee that zooming into areas that cover parts of
two or more neighboring tiles does not cause
visualization problems.
Moving the area in focus to a neighboring tile
automatically calls the script for loading that tile so
that the information resolution is always maintained
according to the zoom level.
The quality and interactivity of visualizing weather data in
the world wide web is highly dependent on the technologies and
formats used. Weather data is highly complex and changes in
three dimensions: time and space (which is in this context
limited to two dimensions). Because of this complexity, good
visualization techniques are required to make weather forecasts
understandable for non expert users.
The project described has shown that interactive visualization of
dynamically changing weather data can be achieved with SVG and
a number of open source software components.
SVG is well suited for this task as it is an XML based
format. This way, SVG can be generated by any standard XML
parser. Since SVG documents can be built modular by using the
<g> (group) tag, the data can be
structured in a most efficient way.
Another advantage of SVG is the format’s dynamics and
interactivity. Data can be reloaded, deleted, altered and
animated. The whole document can accessed via the DOM which can
be manipulated by languages like ECMAScript. This allows for a
very high degree of user interaction, which is not given for
other formats like Macromedia Flash. Adobe’s SVG viewer’s
flexible reload of information enables the use of template-like
structures. This facilitates the development of complex
applications since single components can be built independently
from each other.
The paper has shown how SVG can communicate with databases
and servers. SVG can easily be connected to PHP and data can be
retrieved from servers either directly or via PHP scripts. This
allows for complex client-server interaction.
The weather visualization presented in this paper has shown
how a multitude of SVG’s features can be combined to build
complex and dynamic applications. Designing likewise
applications with other formats or programming languages
usually requires much more effort. This leads to the assumption
that SVG will eventually overcome its current limitation to GIS
applications and that it will spread further in the scientific
application domain.
- [WalchFrater]
-
Wetter und Klima 2004
Springer-Verlag Berlin Heidelberg
- [NOAA]
- Office Note
388 GRIB 28-Feb-2005
http://www.nco.ncep.noaa.gov/pmb/docs/on388/
- [Kunze]
- Ein
Generator für Macromedia Flash zur interaktiven Visualisierung XML
basierter Daten 2001
http://www-lehre.inf.uos.de/~rkunze/flashweather/Diplomarbeit/Diplomarbeit.html
- [Stark]
-
Vektorisierung von raum- und zeitbezogenen Daten zur
Visualisierung mit Macromedia Flash 2001
http://www-lehre.inf.uos.de/~fbstark/diplom/arbeit/html/
- [Macromedia I]
-
Macromedia Flash Player Version Penetration
2005
http://www.macromedia.com/software/player_census/flashplayer/version_penetration.html
- [Macromedia II]
-
The History of Flash
http://www.macromedia.com/macromedia/events/john_gay/page04.html
- [W3C I]
- About
SVG 29-Oct-2004
http://www.w3.org/Graphics/SVG/About
- [W3C II]
- Scalable
Vector Graphics (SVG) 1.0 Specification
04-Sep-2001 http://www.w3.org/TR/SVG10/
- [Adobe I]
- Release
notes and Support; Current support documentation
http://www.adobe.com/svg/indepth/releasenotes.html
- [Mozilla]
-
Mozilla SVG Project 1-May-2005
http://www.mozilla.org/projects/svg
- [Opera]
- SVG -
Scalable Vector Graphics
http://www.opera.com/features/svg
- [Flashkit]
- How
to make Flash movie
http://www.flashkit.com/tutorials/Getting_Started/How_to_m-mark-1137/index.php
- [Fox]
-
Interaktive Visualisierung von optimierten
Zugablaufplänen mit SVG am Beispiel des Bahnhofs
Amsterdam-Schiphol
06-May-2005
http://www.inf.uos.de/prakt/pers/dipl/doc/pfox.pdf
- [Macromedia III]
-
Macromedia Flash File Format (SWF)
http://www.macromedia.com/software/flash/open/licensing/fileformat/
- [Macromedia IV]
-
Macromedia Flash MX Professional 2004
http://www.macromedia.com/software/flash/flashpro/
- [OpenLaszlo]
-
OpenLaszlo 2005
http://www.openlaszlo.com
- [ShigeruMasaru]
-
Geospatial Information Service System for Browser-phones utilizing PSVG
2002
http://www.svgopen.org/2002/papers/shimada_masaru_sitama__geospatial_infoservices_for_mobiles/
- [Moock]
- Essential
ActionScript 2.0 18-Jun-2004 O'Reilly and
Associates
- [WilliamsNeumann]
-
Manipulating SVG Documents Using ECMAScript (Javascript)
and the DOM 11-Feb-2005
http://www.carto.net/papers/svg/manipulating_svg_with_dom_ecmascript/
- [WinterNeumann]
-
Example for getURL and parseXML
15-Feb-2005
http://www.carto.net/papers/svg/samples/get_parse.shtml
- [WilliamJSnyder]
-
Algorithm 531: Contour Plotting
1978 http://portal.acm.org/citation.cfm?id=355800
- [Dickmann]
-
web-mapping und web-gis 2001
westermann
- [HauserWenz]
-
Creating truly dynamic SVG
http://www.svgopen.org/2002/papers/hauser_wenz__scripting_svg/
- [Eisenberg]
-
SVG Essentials
Feb-2002
O'Reilly and Associates
- [Watt et al.]
-
SVG Unleashed
2003
Sams Publishing
XHTML rendition made possible by
SchemaSoft's
Document Interpreter™
technology.