 of a parallel algorithm is measured as the ratio of
the time taken by an equivalent and most efficient sequential implementation,
  ,
divided by the time taken by the parallel algorithm,
  :
:
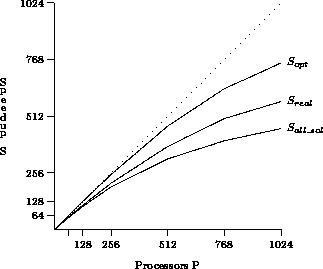
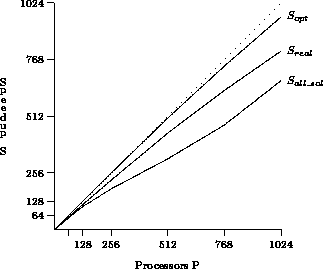
We implemented AIDA* on a 1024-node MIMD transputer system, using the 15-puzzle as a sample application. Figures 2 and 3 show the speedup results for two sets of 25 random problem instances with different difficulties. Speedup anomalies (cf. [Kumar and Rao, 1990]) were avoided by searching all nodes of the last (goal) iteration. We call this the `all-solutions-case' as opposed to the `first-solution-case', where it suffices to find one optimal solution. Our fifty problem instances are the larger ones from Korf [1985], here sorted to the number of node generations in the `all-solutions-case'. We also run AIDA* on Korf's fifty smaller problems. However, with an average parallel solution time of 8 seconds, a 1024-node MIMD system cannot be sufficiently utilized, so we did not include the data in this paper.
The speedup  of a parallel algorithm is measured as the ratio of
the time taken by an equivalent and most efficient sequential implementation,
  ,
divided by the time taken by the parallel algorithm,
  :
:

Care was taken to use the most efficient sequential algorithm for comparison. Our IDA* is written in C and generates nodes at a rate of 35,000 nodes per second on a T805 transputer, corresponding to 350,000 nodes per second on a SUN Classic Workstation, or 660,000 nodes per second on a SUN SparcStation 10/40. Similar sequential IDA* run-times have been reported by Powley et al. [1993].

Figure 2: Speedup, prob. #51..75

Figure 3: Speedup, prob. #76..100
Figures 2 and 3 show the performance results on a torus topology. For each problem set, three graphs are shown:

The topmost graph shows the maximum speedup that could be achieved with an optimal parallel algorithm (with zero overheads) after the first phase is done. This is a hypothetical measure to show how much time is taken by the initial data distribution phase.

The middle graph shows the speedup that would be obtained by a search for the first solution, one that stops right after one solution has been found. It includes the startup-time overhead, the communication overhead due to load balancing and the weak synchronization between iterations of the third phase.

The bottom graph shows the actual speedup (measured in terms of elapsed time) of the `all-solutions-case'. Compared to

, it also contains
termination detection overhead and idle times due to processors which are
done `too soon' in the last iterations while others are still working
on their last subtree.![]()
As is evident from Figures 2 and 3, good speedups are more difficult to achieve for the small problem instances #51..75 than for the hard ones #76..100. On the 1024-node system, the small problems take only an average of 16 seconds to solve, while the more difficult require three minutes. Hence, the negative effect of the initial work distribution, which is about constant for all problems, does not hamper the overall speedup in the hard problems too much.