Here we present the behaviour of eight nets. We have trained nets for
 respectively
  of the number of input neurons.
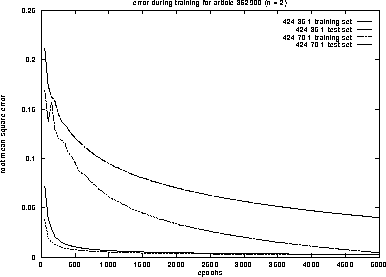
Figure 4: root mean square error of two nets for article 362900 with n = 2
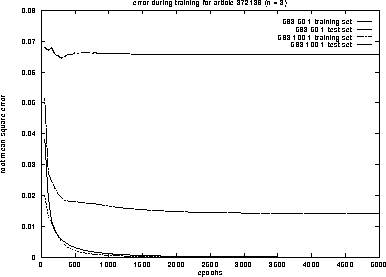
Figure 5: root mean square error of two nets for article 372138 with n = 3
We are using the information of 53 articles in the input layer. The topology of the net is described by the syntax: (input neurons:hidden neurons:output neurons).
The given data is split into a training set (week 36/1994 to week 16/1995) and a test set (week 17/1995). The test set is not trained and only considered to check whether the net has generalized the behaviour of the time series.
With n=2 resp. n=3 we have 31 resp. 30 pairs in the training set and one in the test set. The figures 4 and 5 show the root mean square error on the training and test set, while the nets are learning 5000 epochs. This error is going down immediately on the training set, especially for the larger nets.
More important is the error on the test set --- the prediction error. This is better for the smaller nets. They need more epochs to learn the rule of the time series, but because of this they can generalize their behaviour better.
The prediction error of the smaller nets in means of sales can be seen from figures 1 and 2. For the week 17/1995 the forecasted sales are drawn dotted. For both articles the error is smaller than one piece.
The time for training the nets on a sequential SUN SPARC 20-50 can be seen in table 1.

Table 1: Training times of different nets on SPARC 20-50