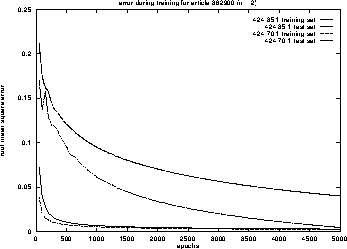
Figure 5: root mean square error of two nets for article 362900 with n = 2
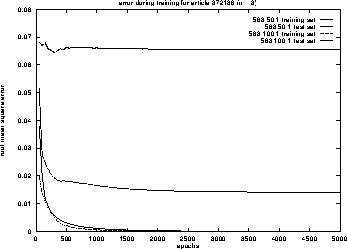
Figure 6: root mean square error of two nets for article 372138 with n = 3
Here we present the behaviour of eight nets. We have trained nets for
The given data is split into a training set (week 36/1994 to week 16/1995) and a test set (week 17/1995). The test set is not trained and only considered to check whether the net has generalized the behaviour of the time series.
With n=2 we have 31 pairs in the training set and one in the test set, with n=3 we have 30 pairs in the training set and one in the test set. The figures 5 and 6 show the root mean square error on the training and the test set, while the nets are learning 5000 epochs. This error is going down immediately on the training set, especially for the larger nets.
| net sizes | 424:35:1 | 424:70:1 | 583:50:1 | 583:100:1 |
| 5000 epochs | 1955 sec | 3896 sec | 3670 sec | 7345 sec |
Table 1: Training times of different nets on SPARC 20-50
More important is the error on the test set --- the prediction error. This is better for the smaller nets. They need more epochs to learn the rule of the time series, but because of this they can generalize their behaviour better.
The prediction error of the smaller nets in means of sales can be seen from figures 1 and 2. For the week 17/1995 the forecasted sales are drawn dotted. For both articles the error is smaller than one piece. The time for training the nets on a sequential SUN SPARC 20-50 can be seen from table 1.
Summarizing the results of the forecasting quality we can say that the error on the test set can be reduced to an acceptable low level. The re-transformation to the sale values shows that we can predict the sale for the next week with an sufficient accuracy after an enormous training effort.